UK Social Media Stats – Where is everyone really hanging out online?

UK Social Media Stats – Where is everyone really hanging out online?
“UK Social Media Stats”
“UK Facebook Useage”
“Social Media UK”
…and the list goes on as I continue with my regular search for statistics on how we’re using social media platforms in the UK. There are masses of resources out there that discuss the subject on a worldwide scale, or about the US market. When it comes to finding stats on the UK market specifically, however, the results are few and far between.
So, on the 31st May when Ofcom published their Online Nation report – to say I was overwhelmed with excitement would be an understatement! This report describes what UK adults are are doing online, where they spend their time, what their attitudes are towards their experience of the internet… it’s a wealth of information. Gold dust for people like me!
I’ve spent most of my time this week reading and re-reading the report, trying to commit the social media stats to memory (I have a terrible memory!) and it dawned on me that the main reason I carry out the searches I do to try and find this type of information is because I am asked regularly about who uses what, whether there has been a shift in popularity of a particular platform, or not in reality, etc. etc. My favourite question is as follows…
“Christina, I believe what you’re saying – but do you have any stats to back that up?”
Well – now I do! I’m not going to go through the report page by page. But here are what I believe to be the headlines and key stats that relate to the use of social media from a commercial perspective. I’ve laid out the information using the kinds of questions I’m asked, how the Stats answer the questions, and then, any specific learning you should take away from this.
Where do people spend their time online in the Uk?
More than a third (35%), of the total time spent online in the UK, is on sites owned by Google or Facebook.
Online Nation, OfCom
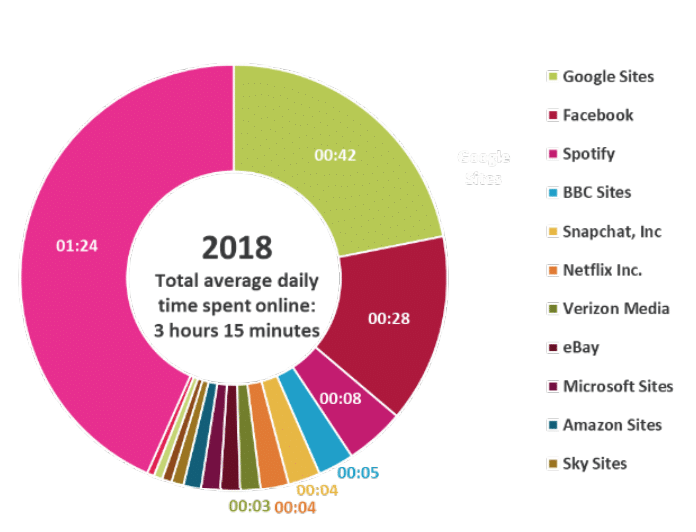
What does that mean? It means we’re spending time consuming video on Youtube and hanging out on Facebook and Instagram! The stats state that 9/10 users are using Youtube each month, equating to almost half an hour on the site per day; the rate of usage is similar when it comes to Facebook with an average of 23 minutes a day being spent on the platform.
What’s the lesson here? If you are still living in a word where you are not using Facebook as a marketing tool, or you are ignoring the power of video – you are really missing out on reaching a considerable portion of your market!
Why is the emphasis on Google when there are so many different ways to search?
People rely on search engines and particularly Google (97% of
Online Nation, OfCom
internet users say they use it, followed by 14% who say they use Bing).
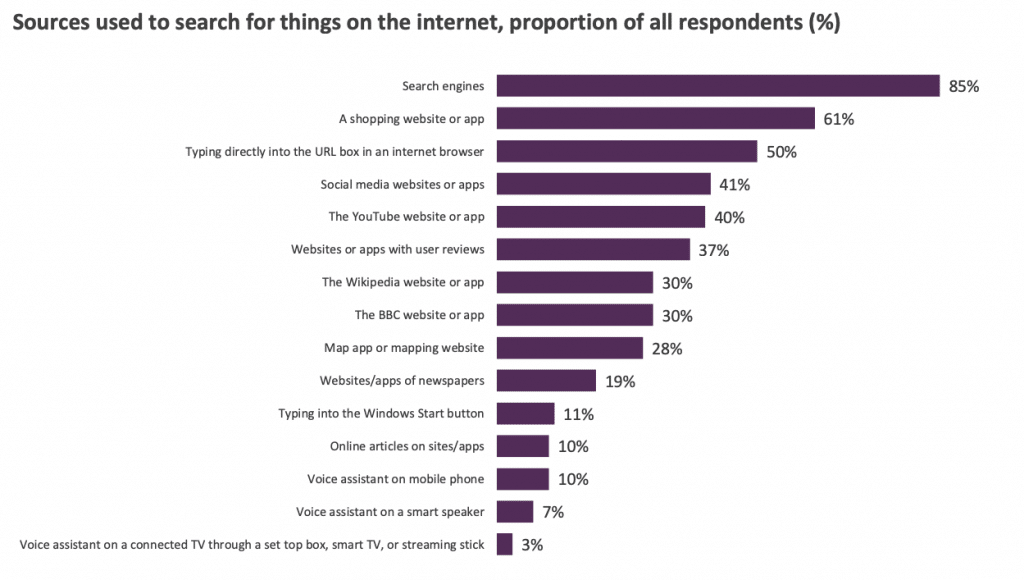
What does this mean? For context, the percentages in the chart relate to a dataset of over 2000 UK adults aged 16 and over. It’s clear that search engines are the tool of choice – and Google continues to remain a market leader in this area (That’s why taking a ‘Google first’ approach is essential).
But as you look down that list, you’ll notice social media is well represented within the top five responses, followed by review sites appearing in the 6th place.
What’s the lesson here? There are a few trends being reflected here that we should make note of and try to incorporate into our digital marketing strategy. As internet users, the UK is showing behaviour that demonstrates a distrust of what is being shared online generally. We have more trust in our peers and are making buying decisions based on a recommendation – to the point it’s reflected in our search habits! The marketing function of your business should be thinking Google first, but then also considering where a follow-up search might be happening and ensure a strong presence on that source too.
Are people still using Facebook?
Facebook is still the largest social media site in the UK in terms of reach, consumption and revenue, although its use has fallen in the last two years, (from 95% of social media users in 2016 to
Online Nation, OfCom
88% in 2018). Use of Facebook-owned properties WhatsApp and Instagram both grew in the same period. There is an increase in people using multiple services…
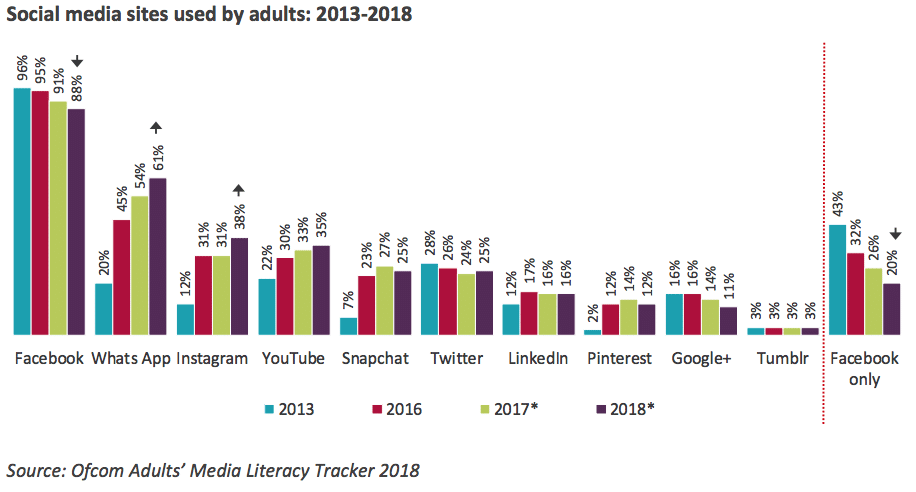
What does this mean? Social Media continues to be something that simply can not be ignored. The report states an average social media usage that totals 39 minutes per day, 23 minutes of which is spent on Facebook alone.
Yes – we’re seeing movement in terms of audience, but when you really drill down into the report, it’s more a case of younger users opting for Instagram before Facebook. Why is this? It comes back to trust – and also the subject of harm as the report suggests Facebook as a platform adults see as having the potential to cause harm.
44% of those surveyed said they use social media to consume news. With that in mind, it’s no surprise that Twitter has remained consistent (albeit with a slight increase) given current affairs over the last year.
What’s the lesson here? Please don’t be fooled by this trend you see in the chart relating to Facebook usage. The fact that Facebook is showing a decline is quickly counteracted by the fact that WhatsApp and Instagram are increasing rapidly. In terms of market share, Facebook continues to dominate given the take-up of it’s ‘family of apps’.
I’d like to draw your attention to the rapid decline in users reporting that they ONLY use Facebook? Where else are your target audience hanging out socially?

UK Social Media Stats – In conclusion
This report is fantastic, and there is a whole host of information that I can pull out for you – but if I’m honest, I’m worried that you might have tuned out already. The trends that are being seen worldwide (I use Hootsuite’s reports as a comparison) are being reflected here in the UK. However, seeing the patterns based on data that is highly relevant to your audience can only improve your confidence when making changes to your online strategies.
If you like data and stats, I encourage you to read the full report – it’s 164 pages of really interesting information on attitudes to social and whether we trust what we see online; the harm posed by social media platforms and the use of social by those under the age of 16.
I am desperate to talk about this report – so read it, comment with what you find interesting, I’d love to hear your thoughts!

Christina Robinson is the Managing Director of Green Umbrella Marketing. She provides Social Media Training and Coaching for a range of clients throughout the UK.
Share this!